


Cost is the first question every operations leader asks before deploying Autonomous Mobile Robots (AMRs):
“How much do AMRs cost?”
“What is the payback period?”
“Are AMRs worth the investment compared to manual movement or forklifts?”
This guide breaks down AMR costs, hidden expenses that people often overlook, ROI calculations, and how to estimate savings for your specific facility.
By the end, you’ll have a clear financial picture to make an informed decision.
Discover how the right Autonomous Mobile Robot (AMR) solutions drive business efficiency.
Download our free eBook for expert insights and trends!
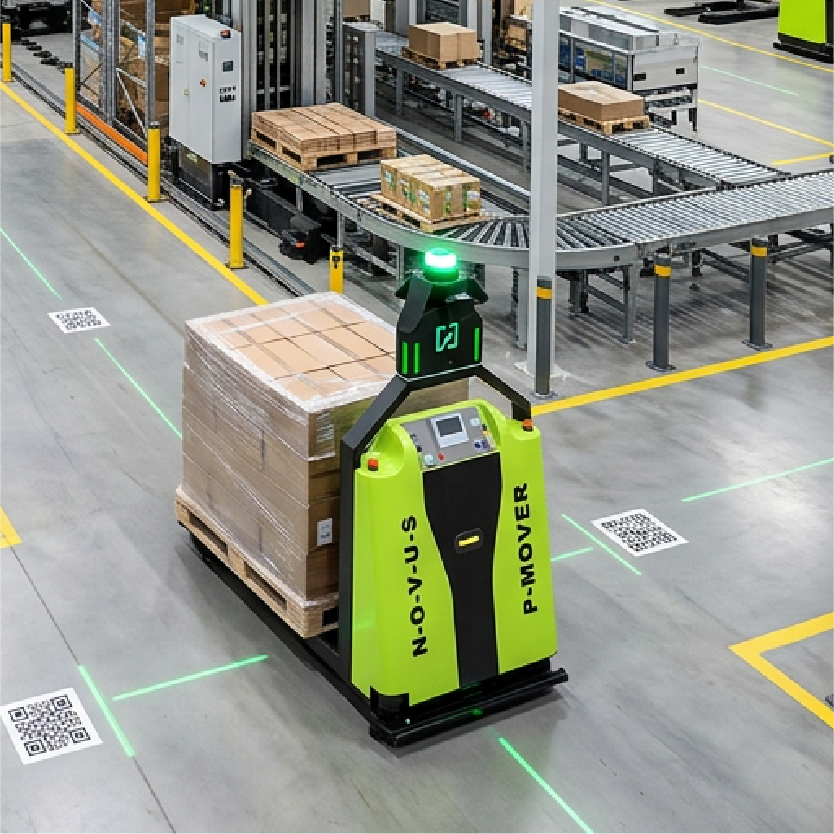
What Is the Cost of an AMR?
The cost of AMRs depends on type, payload, technology, and environment.
Typical price ranges:
| AMR Type | Approx. Cost Range |
|---|---|
| Pallet Truck AMR | ₹22–38 lakh |
| Forklift AMR | ₹40–80+ lakh |
| Tugger AMR | ₹25–45 lakh |
| Conveyor-Top AMR | ₹15–28 lakh |
| Shelf-Carrying AMR | ₹18–40 lakh |
| Sorting AMR | ₹18–35 lakh |
| Heavy-Duty AMR (5–50 tons) | ₹75 lakh – ₹3 crore |
Note: These are realistic market ranges. Actual pricing varies by configuration, payload, performance, and software features.
But robot price is only 1 part of the actual cost picture.
To understand ROI, you must understand the full cost structure.
Total Cost of Ownership (TCO) for AMRs
TCO includes:
- Robot Hardware Cost
- Fleet Management Software license
- Integration & commissioning
- Battery tech (Li-ion / LFP)
- IT & connectivity setup
- Annual maintenance
- Charging infrastructure
- Training & workflow design
Below is the detailed breakdown.
1. Hardware Cost
Depends on:
- Payload capacity
- Sensor configuration (2D/3D LiDAR, depth cameras)
- Navigation intelligence
- Battery technology
- Drive system
- Form factor
Heavier loads, higher tech, and complex navigation = higher cost.
2. Fleet Management Software (FMS)
FMS is the brain behind multi-robot coordination.
Typical models:
- Subscription (annual)
- One-time license + AMC
- Per-robot seat license
Includes:
- Traffic control
- Task scheduling
- Real-time dashboards
- Analytics
- Integration APIs (WMS/ERP/MES)
3. Integration & Engineering Services
Includes:
- Workflow design
- Layout mapping
- Charging strategy
- WMS/ERP integration
- Validation and FAT/SAT
- Safety zoning
Average engineering & integration cost: 12–25% of total system value.
4. Battery & Charging Infra
Battery impacts:
- Uptime
- Charging time
- Lifespan
- Heat performance
Options include:
- Li-ion
- LFP
- Fast-charging
Charging setups:
- Opportunity chargers
- Auto-docking chargers
- Battery swapping (rare)
5. Network Infrastructure
AMRs need:
- Strong Wi-Fi
- Managed switches
- Backup connectivity
- VLAN segmentation
Network upgrades are often required for older facilities.
6. Annual Maintenance Cost (AMC)
AMRs need:
- Sensor calibration
- Firmware updates
- Preventive maintenance
- Spare parts
- On-site support
AMC typically: 8–12% of annual system cost.
7. Training & Change Management
AMR deployments also require:
- Operator training
- Safety training
- IT training
- Support training
Training ensures faster adoption and fewer operational disruptions.
What Costs Do AMRs Eliminate?
This is where savings become significant.
AMRs reduce or eliminate the following expenses:
✔ Forklift operator salaries
✔ Overtime payments
✔ Annual forklift maintenance
✔ Fuel/diesel/electricity for forklifts
✔ Manual pallet jack movement cost
✔ Accident-related expenses
✔ Damage to goods/equipment
✔ Route inefficiency losses
✔ Shift-based labor shortage challenges
✔ Training & replacement cost due to attrition
✔ Shutdowns due to inconsistent material flow
This makes ROI extremely strong when implemented correctly.
Discover how the right Autonomous Mobile Robot (AMR) solutions drive business efficiency.
Download our free eBook for expert insights and trends!
How to Calculate AMR ROI (Simple Formula)
Here is a clean, practical calculation:
Step 1: Calculate annual manual movement cost
Annual Labor Cost =
(# of operators × cost per operator × shifts × days)
Add:
- forklift or pallet truck maintenance
- fuel/power consumption
- downtime costs
- error/damage cost
- supervision cost
Step 2: Calculate annual AMR cost
Annual AMR Cost =
(depreciation cost + AMC + power + software + minimal operator)
Step 3: Calculate savings
Annual Savings =
Manual movement cost – AMR cost
Step 4: Calculate payback period
Payback (in years) =
(Total AMR system investment) ÷ (Annual savings)
Example ROI Calculation (Realistic Scenario)
Factory moves:
- 300 pallet movements per day
- 2-shift operation
- 7 forklift operators
- Avg cost per operator: ₹35,000/month
- Forklift OPEX: ₹6–9 lakh/year
Total manual movement cost:
≈ ₹59–68 lakh/year
AMR system:
- 3 Pallet Truck AMRs
- Total investment ≈ ₹75–90 lakh
- Annual AMR cost ≈ ₹12–15 lakh
Annual savings:
≈ ₹45–55 lakh/year
Payback:
16–22 months
This is consistent across most FMCG, automotive, pharma, EV, and electronics facilities.
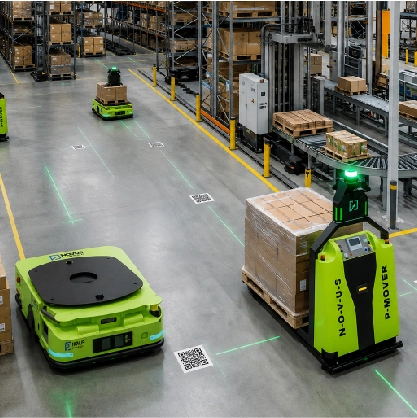
When Do AMRs Deliver the Maximum ROI?
AMRs produce the fastest ROI in:
1. Multi-shift operations
2–3 shifts → ROI accelerates significantly.
2. High-volume repetitive movement
More movements = more savings.
3. Facilities with labor shortages
AMRs stabilize operations.
4. Layouts with congestion
AMRs optimize traffic, reducing delays.
5. Environments with frequent damage
Smooth AMR motion reduces product loss.
6. JIT/JIS manufacturing workflows
Consistent takt time = major financial gain.
7. E-commerce and 3PL environments
High SKU velocity = high ROI.
Hidden Savings Most Leaders Don’t Consider
AMRs improve more than just movement cost.
AMRs also reduce:
- Line stoppages
- Inventory pile-ups
- Human fatigue
- Safety audit findings
- Material search time
- Inbound/outbound delays
- Packaging damage
- Operator-to-operator variability
These indirect savings often surpass direct labor savings.
Cost Comparison: AMRs vs Forklifts vs AGVs
| Cost Category | Manual / Forklift | AGV | AMR |
|---|---|---|---|
| Capex | Low | Medium | High |
| Opex | Very high | Medium | Low |
| Flexibility | Medium | Low | High |
| Safety | Low | Medium | High |
| Throughput | Variable | Predictable | High |
| Infrastructure | None | High | None |
| Scalability | Poor | Limited | Excellent |
| Lifetime Cost | Highest | Medium | Lowest |
AMRs clearly win in long-term cost efficiency.
How to Justify AMR Investment Internally
Automation buyers must often convince:
- Plant heads
- Finance teams
- SCM leaders
- Operations heads
- Global leadership
- Corporate engineering
Use this internal pitch:
1. AMRs reduce cost per movement
From ₹5–₹14 per movement → ₹1–₹3 per movement.
2. AMRs eliminate dependency on operators for movement
A major concern in high-attrition industries.
3. AMRs prevent safety incidents
Often the single biggest hidden cost.
4. AMRs make line-side and warehouse flow predictable
Stability is a huge productivity multiplier.
5. AMRs integrate with Industry 4.0 goals
Supports digital transformation and data-driven operations.
Conclusion
AMRs offer one of the strongest ROIs in factory and warehouse automation.
They reduce labor dependencies, boost productivity, eliminate errors, increase safety, and deliver predictable, uninterrupted movement.
Most facilities achieve ROI within 12–24 months, and some within 8–14 months when deployed in multi-shift operations.
AMRs are not an expense — they are a compounding operational investment.
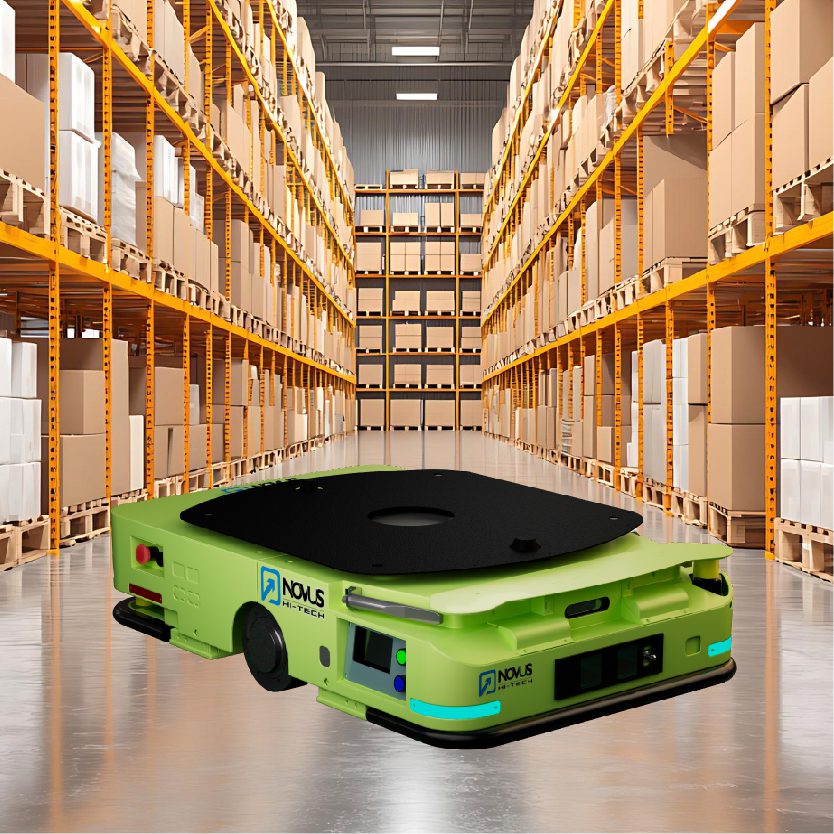
How Novus Hi-Tech Helps You Build a High-ROI AMR Program
Novus Hi-Tech — a global pioneer in AI-driven robotics and AMR/AGV technologies — helps organizations unlock real ROI from autonomous mobility. With:
- 150+ patents
- 1,200+ AMRs/AGVs deployed
- 8 million+ km autonomous travel
- 100+ enterprise customers
Our team helps you:
- Analyse your current movement cost
- Identify high-impact AMR use-cases
- Model payback period
- Scale AMR fleets across buildings and sites
📩 Request a detailed ROI simulation for your facility:
marketing@novushitech.com
Let’s build intralogistics that pay for themselves — every single day.